User Guide for Plan Vivo Platform
Close and open this instruction panel with the small arrow directly to the left of this.
The Plan Vivo Projects Platform provides an interactive map displaying both current and pipeline Plan Vivo projects, along with contextual backdrop mapping. Projects can be distinguished by their activity type, or whether they are current or future projects.
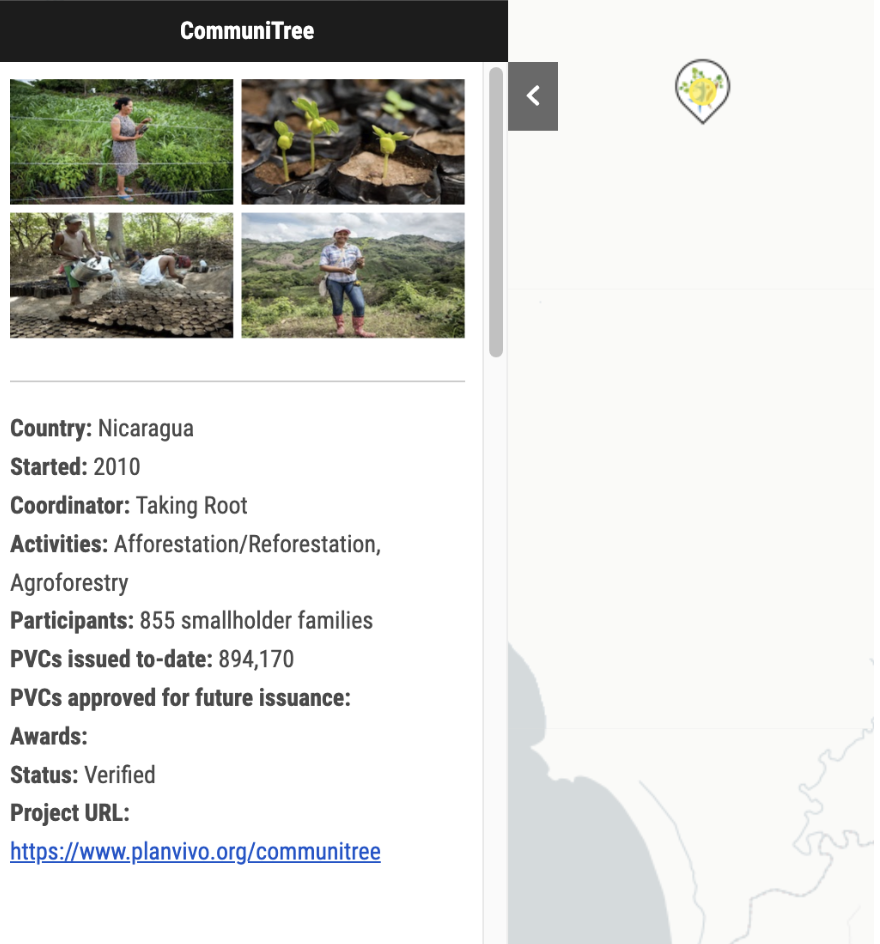
Project details such as the start date, coordinator, or activities are visible by clicking on a project point or area to activate the feature information pop up box.
1. Searching and Navigating
This platform is similar to other web maps - you can zoom in and out and pan to your areas of interest.
Using the Search bar, you can search for geographic locations, addresses, or even for specific projects.
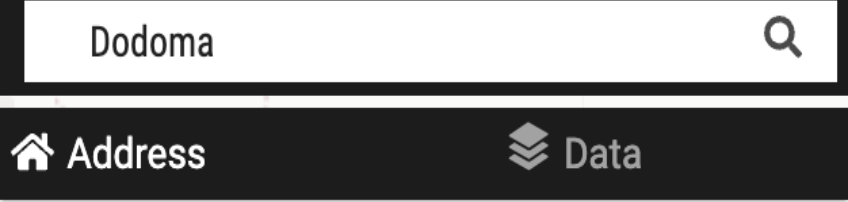
To search for a
location or an address, simply type in the address box and click on the correct result.
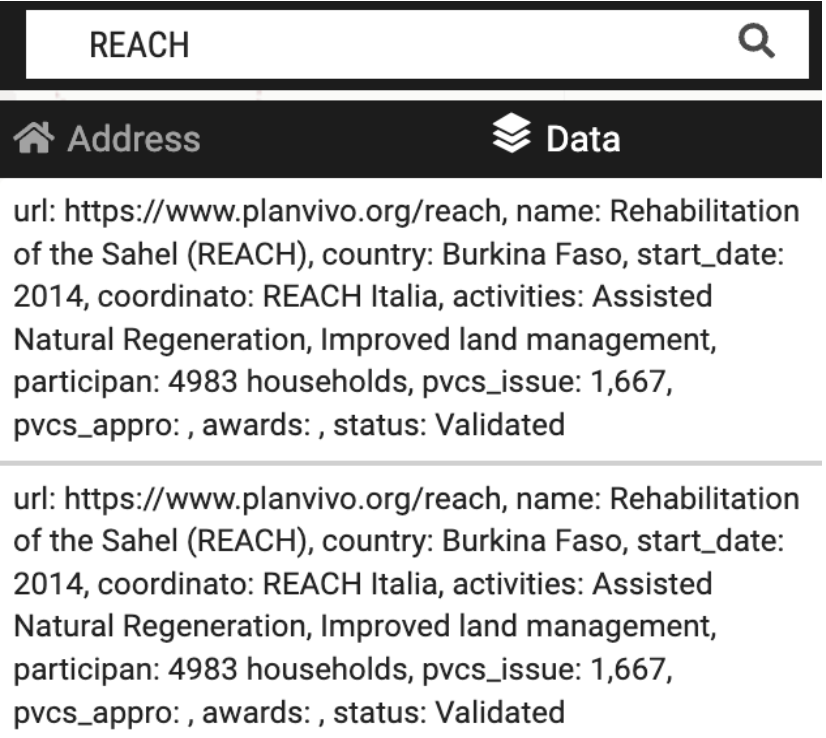
To search for a
project, click in the Search bar and click on Data. Then, start typing the project name and select the result.
If you would like to search by activity or Sustainable Development Goal (SDG), first click on the honeycomb icon below the layers icon.

This will open the 'Query Tool'.
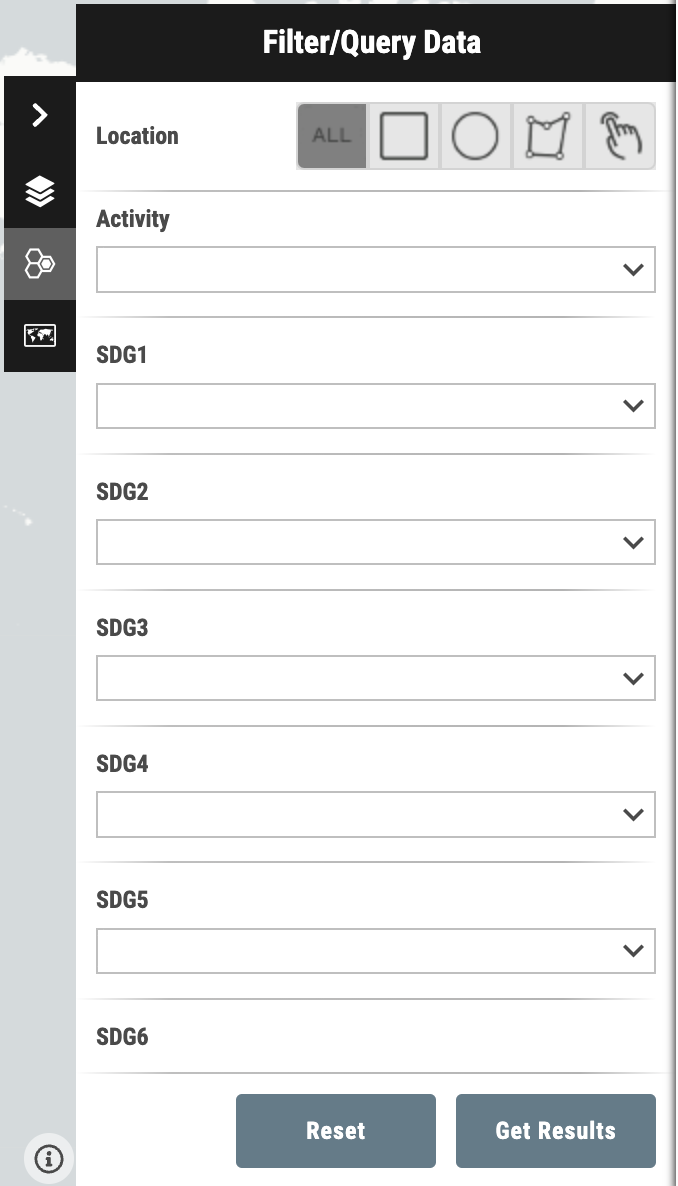
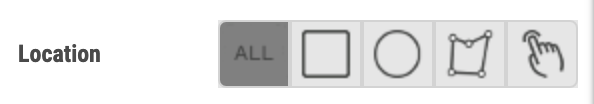
Users may use the Location category at the top to draw shapes in areas of interest to filter this information.
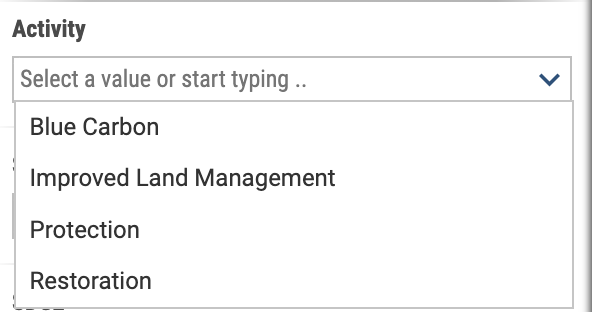
To sort by activity, click the drop down menu labelled 'Activity' and select the desired category. This will provide only projects that contribute in that category.
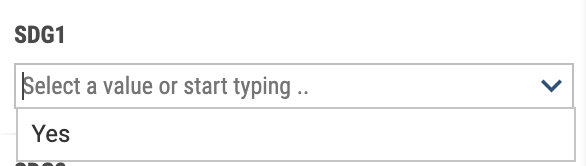
To sort by Sustainable Development Goal, select the drop down menu for the desired SDG and click 'Yes'. This will provide only the projects that contribute to that goal.
2. Interacting with Data
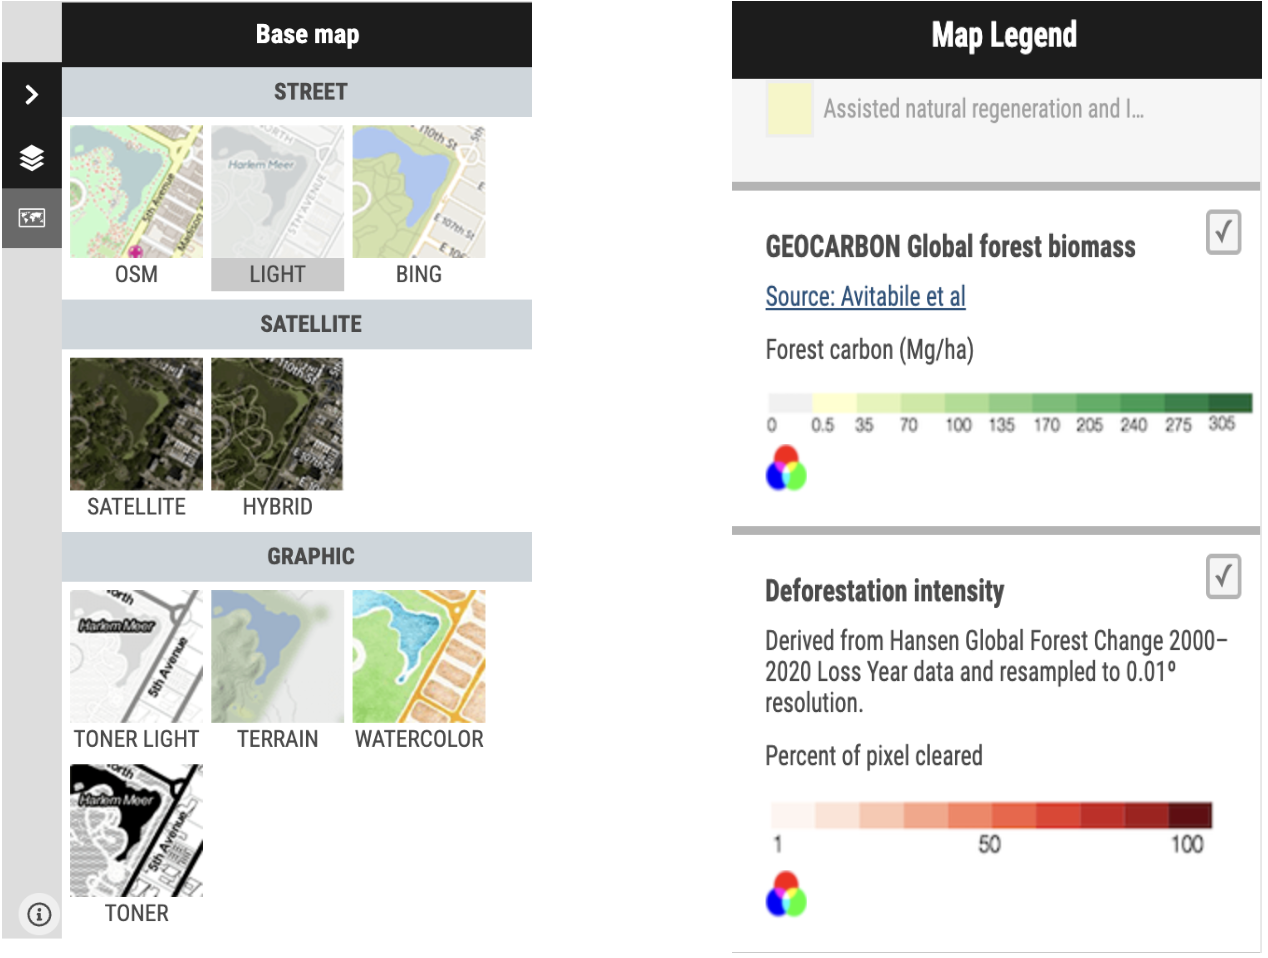
Map layers are easily manipulated in the side panel on the right side of the map. To change the base map, click on the third icon in the shape of a map to access Street, Satellite, and Graphic views.
Above this is the layers icon. Click this to toggle which projects interest you, or to manipulate the contextual layers available such as global forest biomass or deforestation intensity.
To view details about a project, click on either a point or a project icon, the pop up box will expand with information.
In the top right corner of the window, you are able to manually zoom in and out, as well as refresh the map to reload features or to reset the map layers.

Arrows on both sides of the window allow you to expand or contract information panels to see a larger or smaller area of the window.
Registered projects
Pipeline projects
Registered project areas
Current Plan Vivo project areas by the main activity type
Mangrove Above Ground Biomass
Source: Simard et al. 2019
Above ground biomass available in relevant mangrove project areas.
NB: Data is only shown for Honduras, Kenya, Madagascar, Mexico and Tanzania.
Mg ha-1
Protected Areas
Derived from the World Database on Protected Areas (WDPA) licensed by the IBAT Alliance. Note: some countries do not provide data on protected areas, therefore absence of being in a protected area does not necessarily indicate unprotected areas.